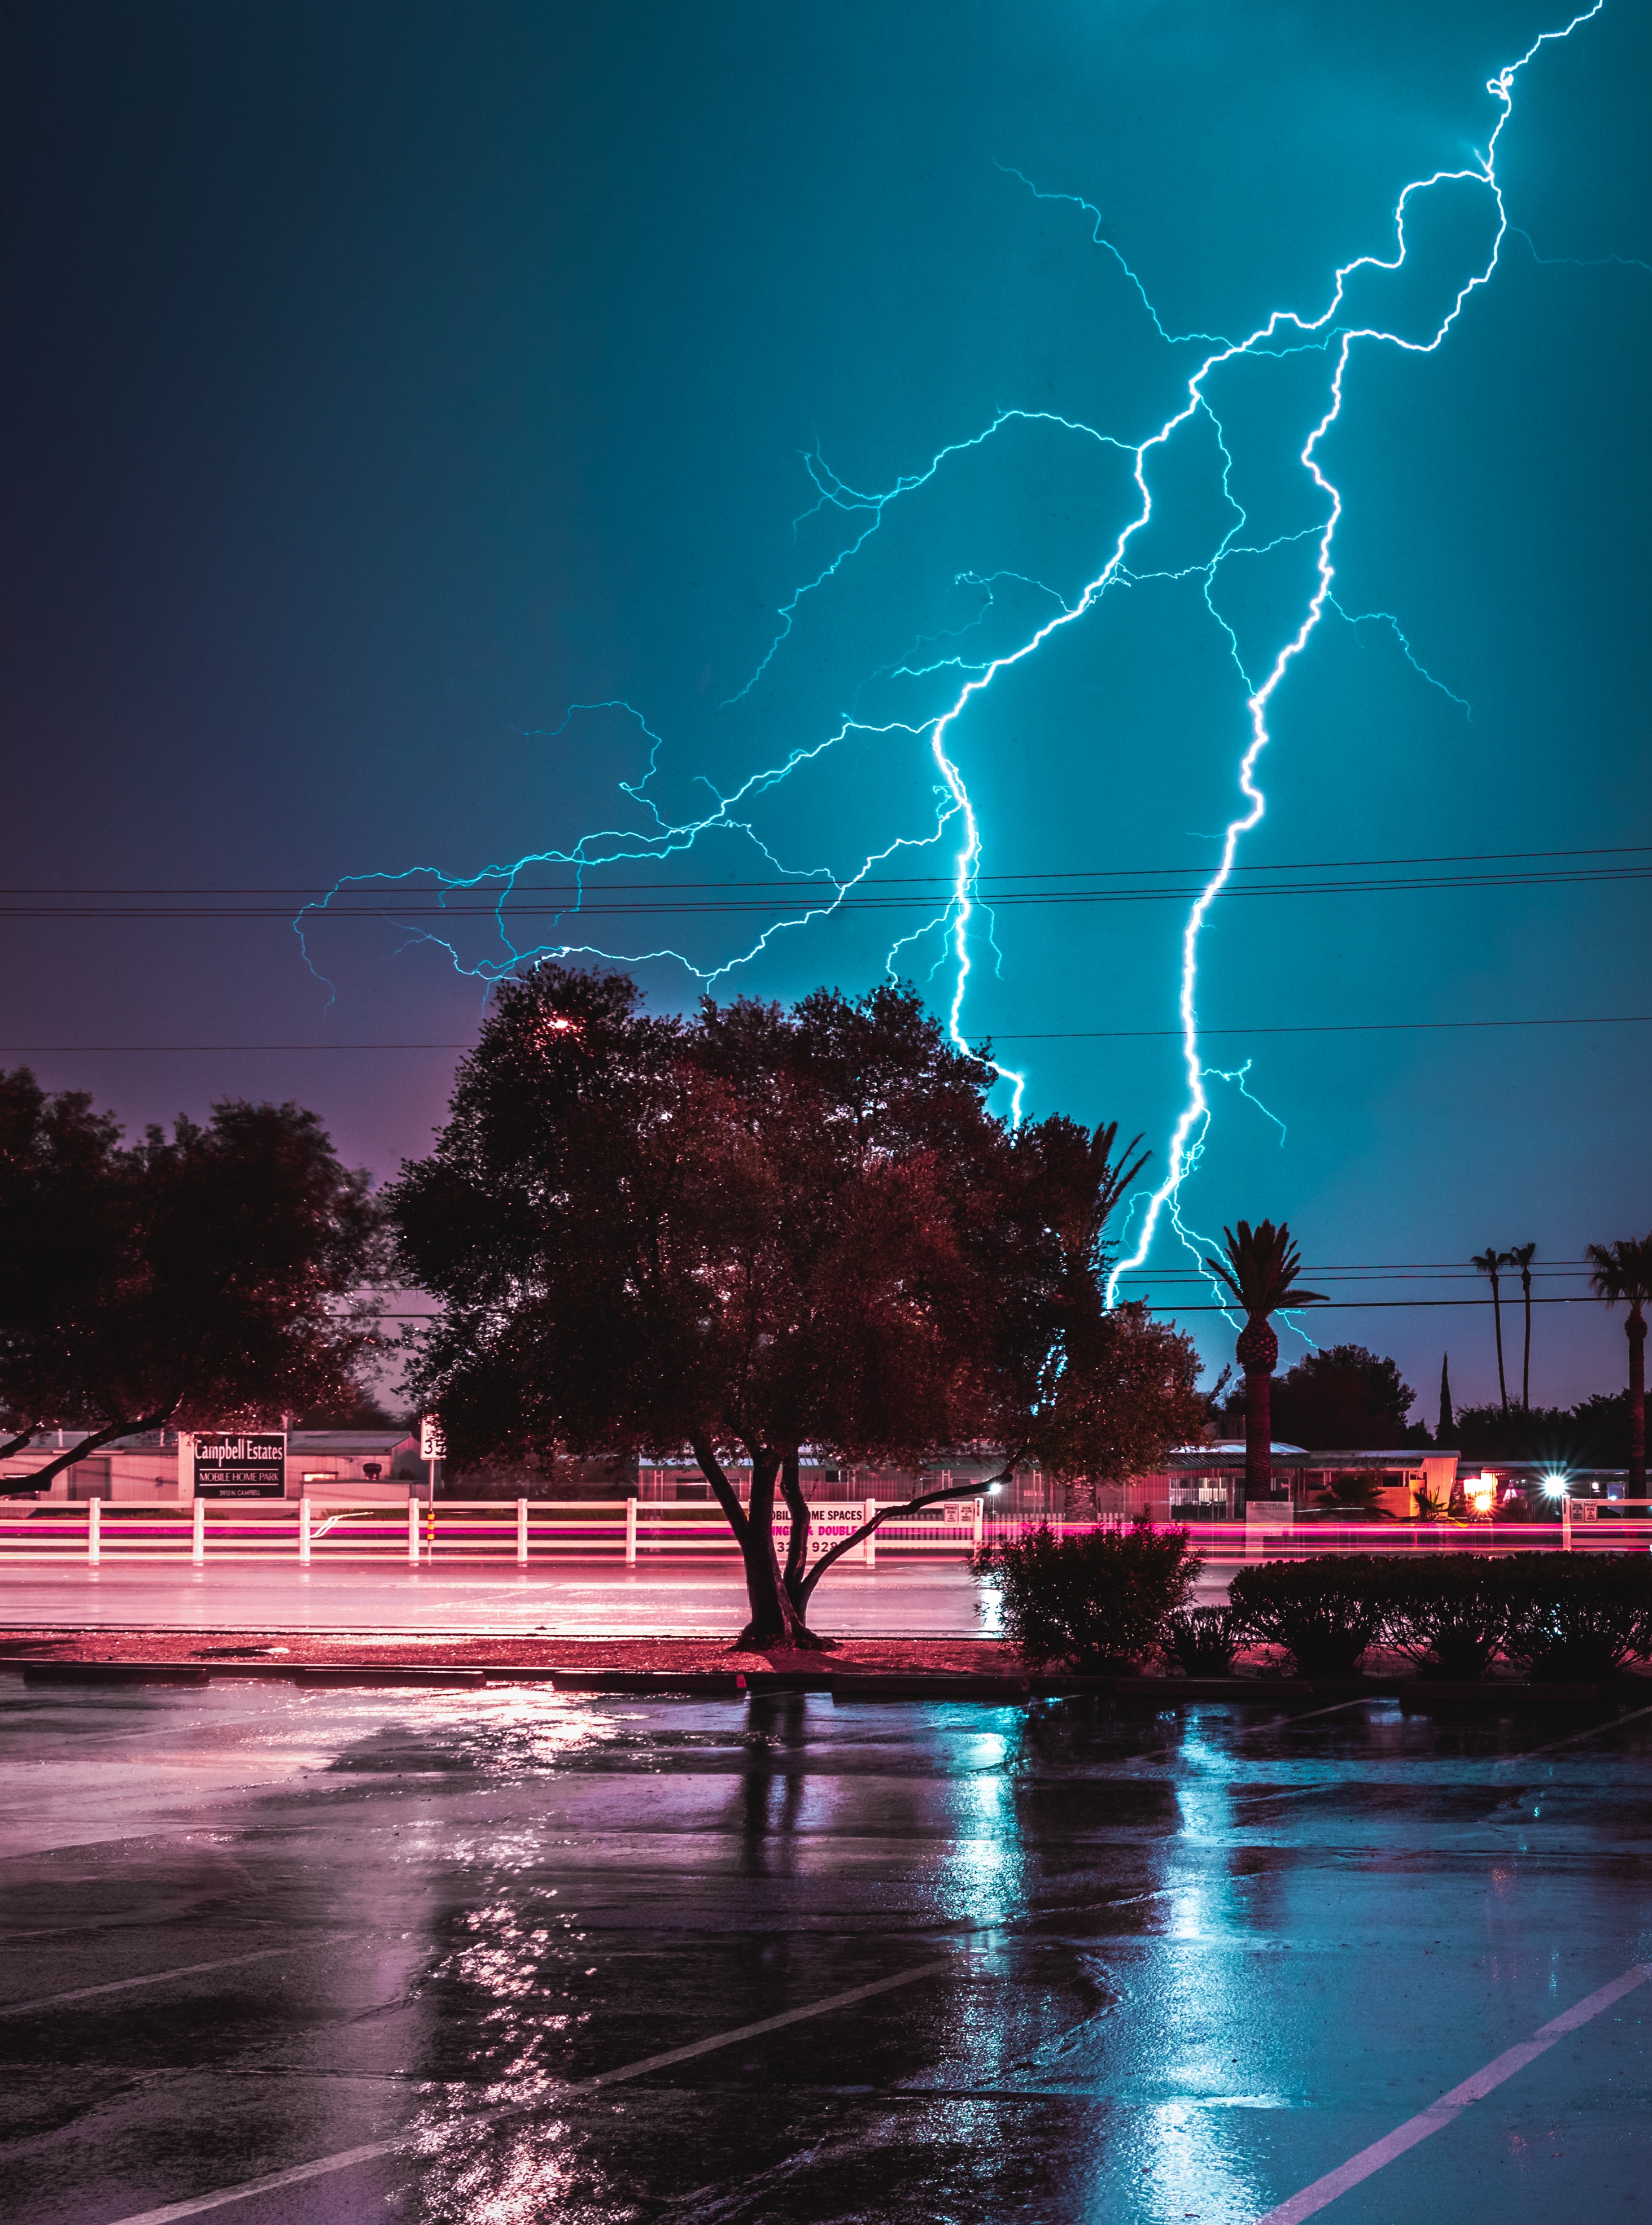
10 Nov Lightning protection systems in high lightning density areas
Some may say that Early Streamer Emission (ESE) technology suffers from lack of experience. The main argument is the location of the ESE historic and prominent manufacturers: they are based in Western Europe with low lightning density compared to the other regions in the world (see https://interactive-lightning-map.vaisala.com/).
The explanation is rather simple: France and Spain where the first countries releasing a proper ESE standards (namely NF C 17 102 and UNE 21 186), then followed by several other countries.
But this is a fact: these two countries, with Ng density of 3 on average, are far from the most lightning prone areas worldwide: more than 40 in South East Asia, Central Africa or Central America.
The first hint came from two lightning high density countries:
- Malaysia has an average lightning density of 51.9 event/km²/year. A survey has been released in 2016 (conducted by Mega Jati institute on behalf of ST group, available here: Part 1 & Part 2): the percentage of buildings with lightning damages stands at 7.18% for meshed cage/single rods protected buildings vs 4.68% for ESE protected buildings.
- With a 60.1 event/km²/year, Cuba also stands as at a very high rate of lightning probability. In 2021, the local government agency APCI released a technical paper based on 20 years of ESE rods installation across the country. The “failure rates” of ESE installations is 0.2% whereas it reaches 0.59% for other lightning protection systems.
In both cases, the rate of incidents / damages is lower for the ESE lightning protection systems.
The ILPA is also working on another statistical survey to assess the geographic distribution of ESE installations worldwide: what is the percentage of ESE rods installed in high-density areas (Ng > 10 event/km²/year) compared with lower ones.
We will soon release this data on ILPA website.
Stay tuned !


Sorry, the comment form is closed at this time.